Gmail Data Visualization with d3.js
TL/DR; see the visualization in action.
Google now allows gmail users to download a complete archive of their Google
Services from Google Takeout. I
downloaded a copy of my gmail account and decided to poke around a bit. I've
always enjoyed manipulating large amounts textual data with the old school UNIX
commands, sed, awk, cut, grep, etc. so this sounded like a good excuse
to have some fun.
It took nearly two hours before my archive was available for download. Google
runs a backup at the time you request a download then the file itself was a
couple of gigs. I wasn't sure what to format to expect my gmail backup.
Google archives all of my emails in to a single .mbox file. The file was
massive. 1.4 Gigs of straight text. Attachments are stored in the mbox file
as well. They are base64 encoded and attached as a multipart email attachment.
Long story short, I parsed the gmail.mbox, extracted a few meta data points
from each email, and strored the results in a SQL database.

A very useful piece of meta data is the custom X-Gmail-Labels header google
adds to all emails. The value of the header are the labels applied to an email
I receive. I have around one hundred filter rules for incoming mail so each
piece is categorized. Anything in the Inbox category is an email not
matching a filter rule.
From 1457861861978585811@xxx Tue Jan 21 05:30:14 2014
X-GM-THRID: 1457861861978585811
X-Gmail-Labels: Basecamp,VE,Important                 # <---- BOOM
...
I spent a fair amount of time deciding how I will visualize the data. After several SQL queries and a few dead ends I took inspiration from Mike Bostock's NYT visualization for President Obama's 2013 budget.
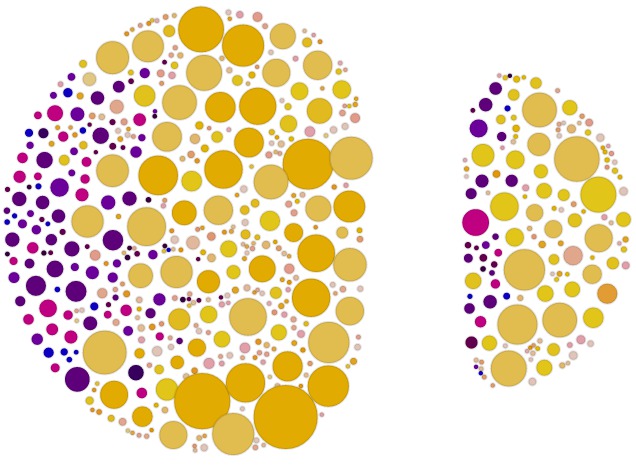
Overall the project was alot of fun. d3.js is an amazing tool with a steep learning curve. It seemed forever before I understand d3's force layout. In the end, I'm not proud of the JavaScript code, but by the conclusion of the project I needed to plow though and finish things while I still had steam.
See the visualization in action.
Discussion on Hacker News.